1.6. Harvest data with a notebook
Duration: 30 min
Goals
- Learn how to run a Jupyter notebook from Google Colab
- Call an API to get data
- Make an annotated visualization
Case
Still the topic of energy conversion, but this time using 22 articles (which is why a notebook becomes practical).
Data
Download this CSV:
wikipedia-articles - 22 energy conversion articles.csv
It just contains a list of 22 articles about energy conversion. In fact, this list is just a small part of the articles about energy conversion, but we thought that it would be enough for now.
If you feel like it, you can try the list of 139 articles from the first level of the Wikipedia category. Expect the notebook to take about 10 minutes to run, then.
Open the notebook in Google Colab
A bit of context:
- A Jupyter notebook is an online document that contains executable code (in Python), text, and images.
- Executing the code requires a computer. For instance your own computer with Anaconda; but that is not what we will use.
- We will use Google Colab, an environment offered by Google where the code is executed on a virtual machine. It requires a Google account (just like Sheets).
- The script calls the API of Wikipedia to ask for all the edits on each of the pages on the list. These edits are called reivions and are available through this endpoint.
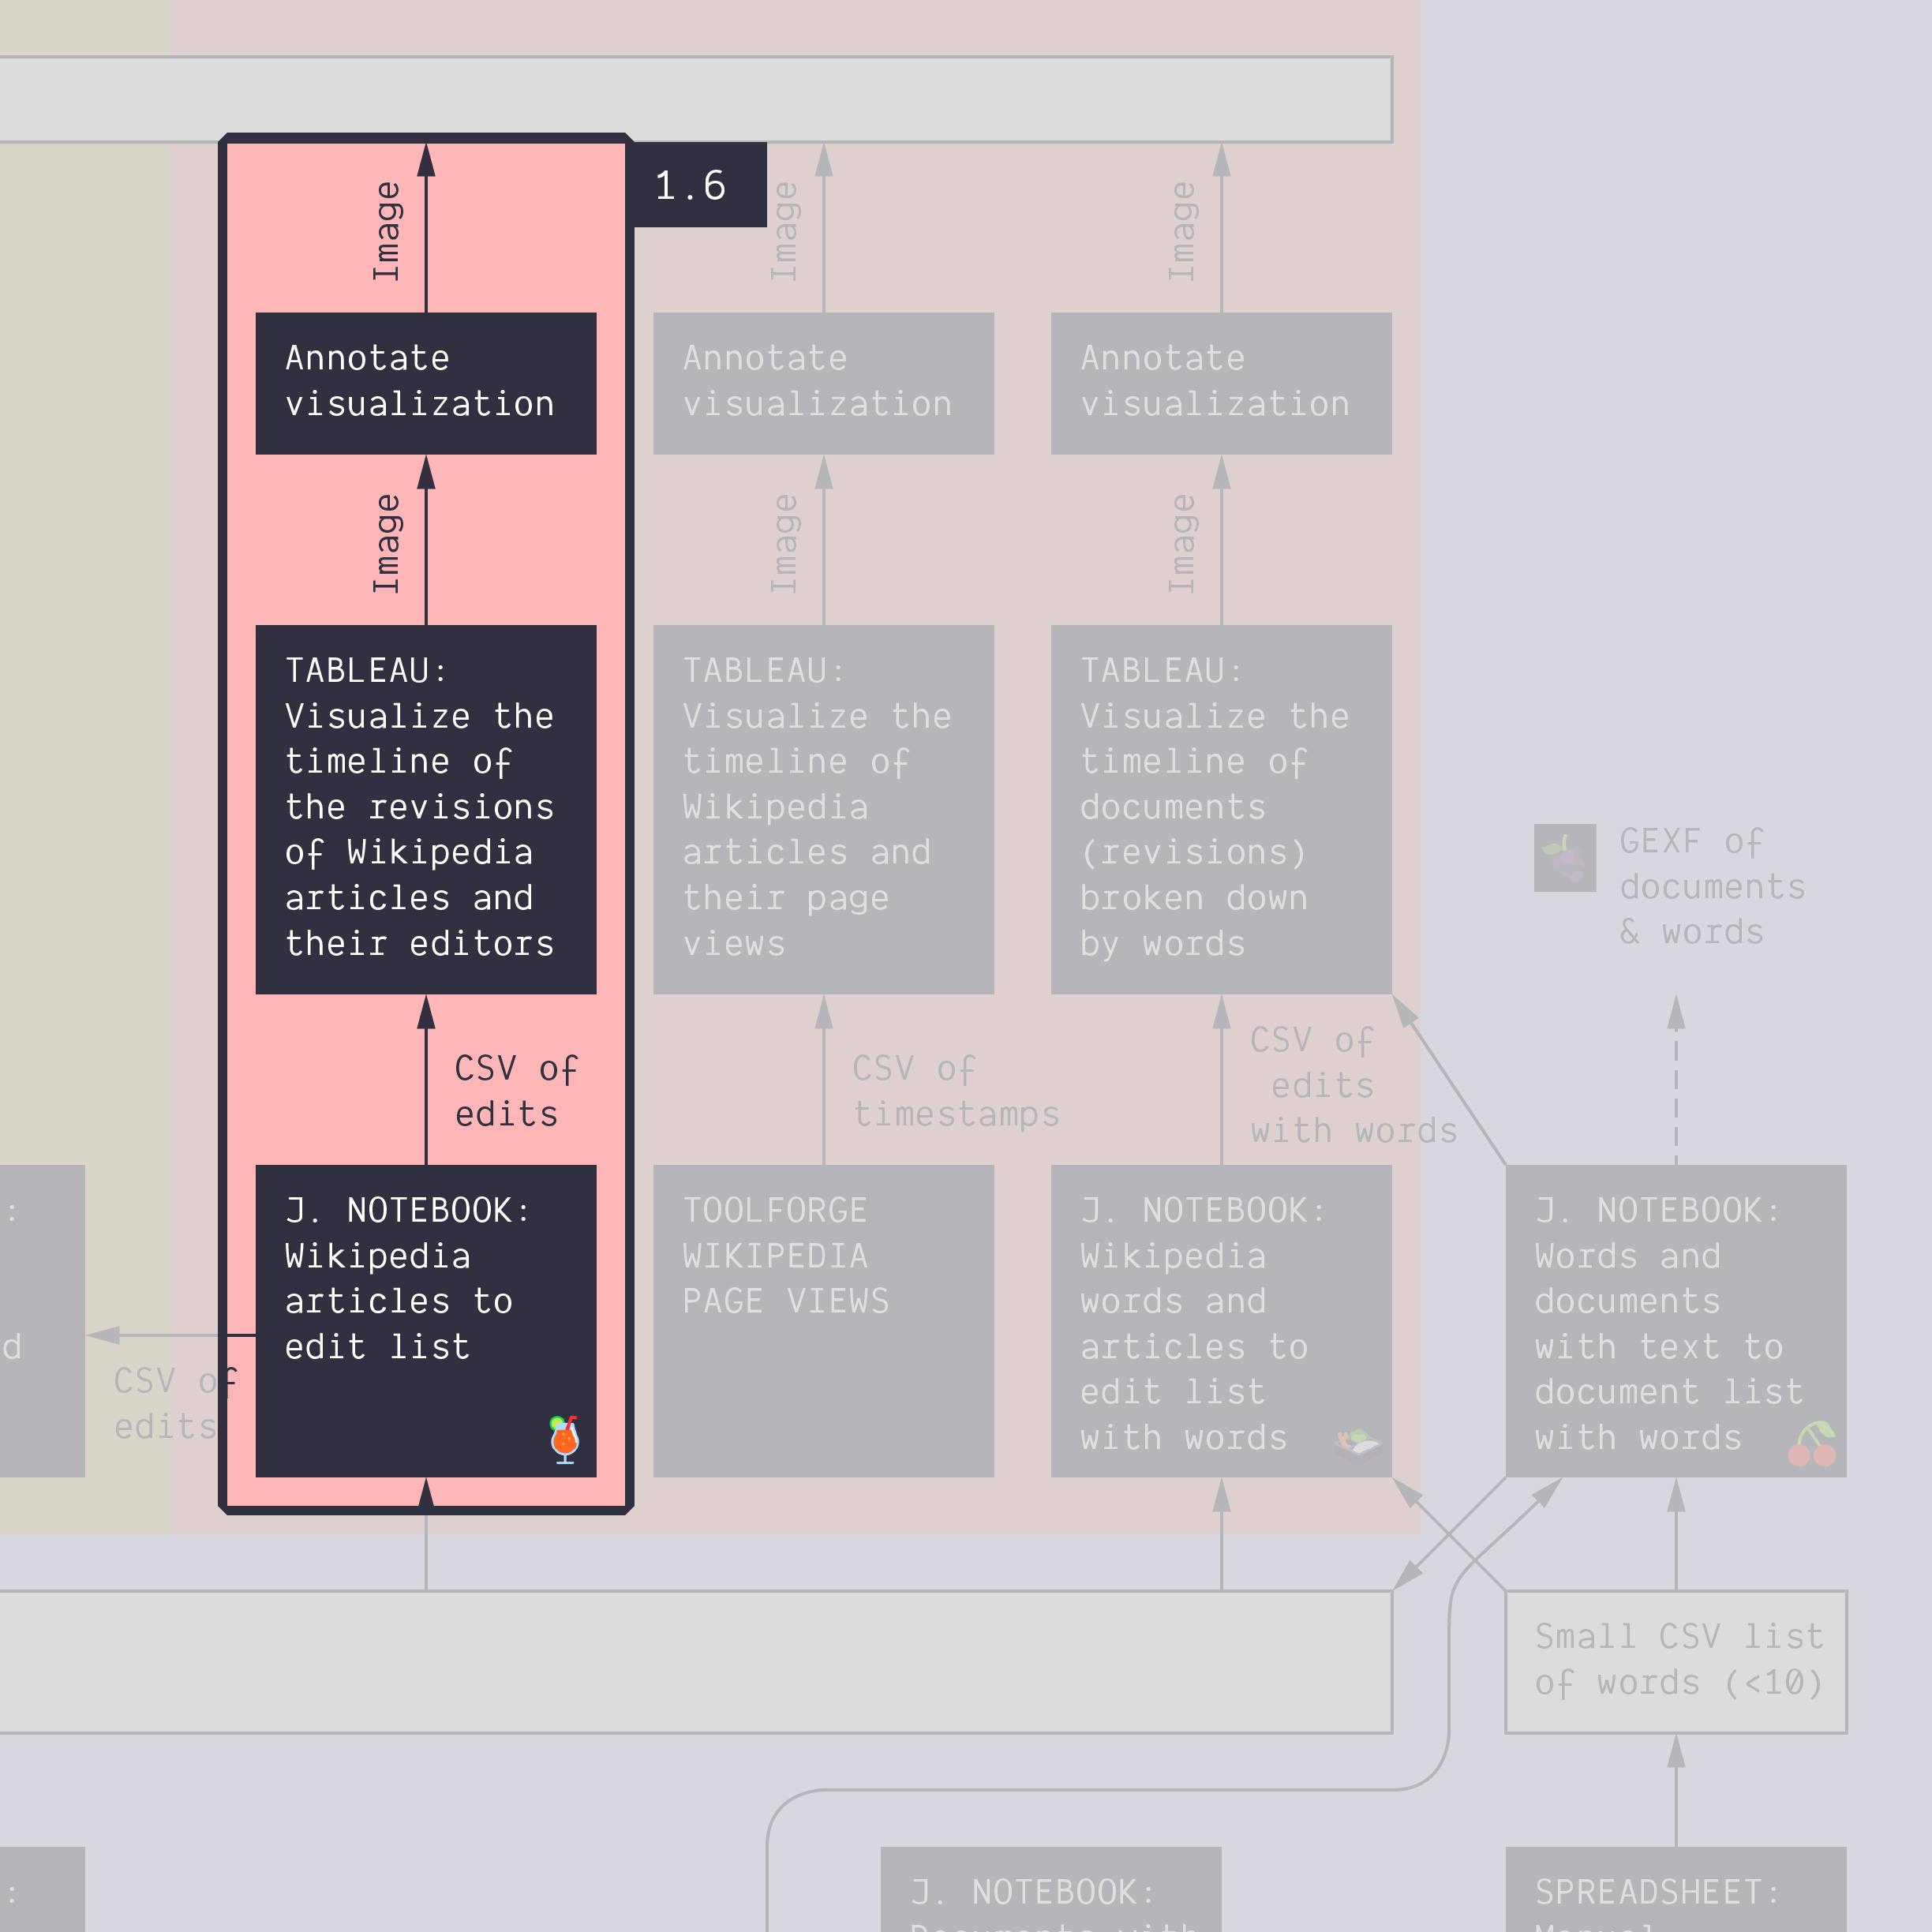
We will use the following script. It opens directly in Colab (although it is actually stored on GitHub).
🍹 Wikipedia articles to edits list
Note: the emoji of each notebook is just there to help you memorize which notebook does what.
But check this tutorial first. It uses the same file and notebook.
Run the notebook to harvest data
- Upload the CSV data into the virtual machine. Click on the
Fileicon on the left, then on the icon on top the readsUpload to session storageand upload the CSV from above. - Read the notebook text itself,
SETTINGSincluded, stopping atSCRIPT. You are not expected to understand the code itself. Just what it does. - Edit the settings. In particular, the name of the input file is probably not that indicated in the settings. You can change the variable in the settings, or rename the file in the virtual machine.
- Run the notebook. Each cell can be executed individually, but we recommend to run everything at once from the menu:
Runtime > Run all. It is done when the last cell outputs “Done”. - Download the output file from the virtual machine. First you to refresh the files of the virtual machine, in the side bar, by clicking on the
Refreshicon. Then look for the output file, whose name was specified in the settings of the script, and download it via its drop-down menu, on the three dots on the right of the file.
You should obtain a file like this one.
Make an annotated visualization
The exercise is basically the same as tutorials 1.2 and 1.3, but this time you have more articles.
The tableau visualization may look like this…
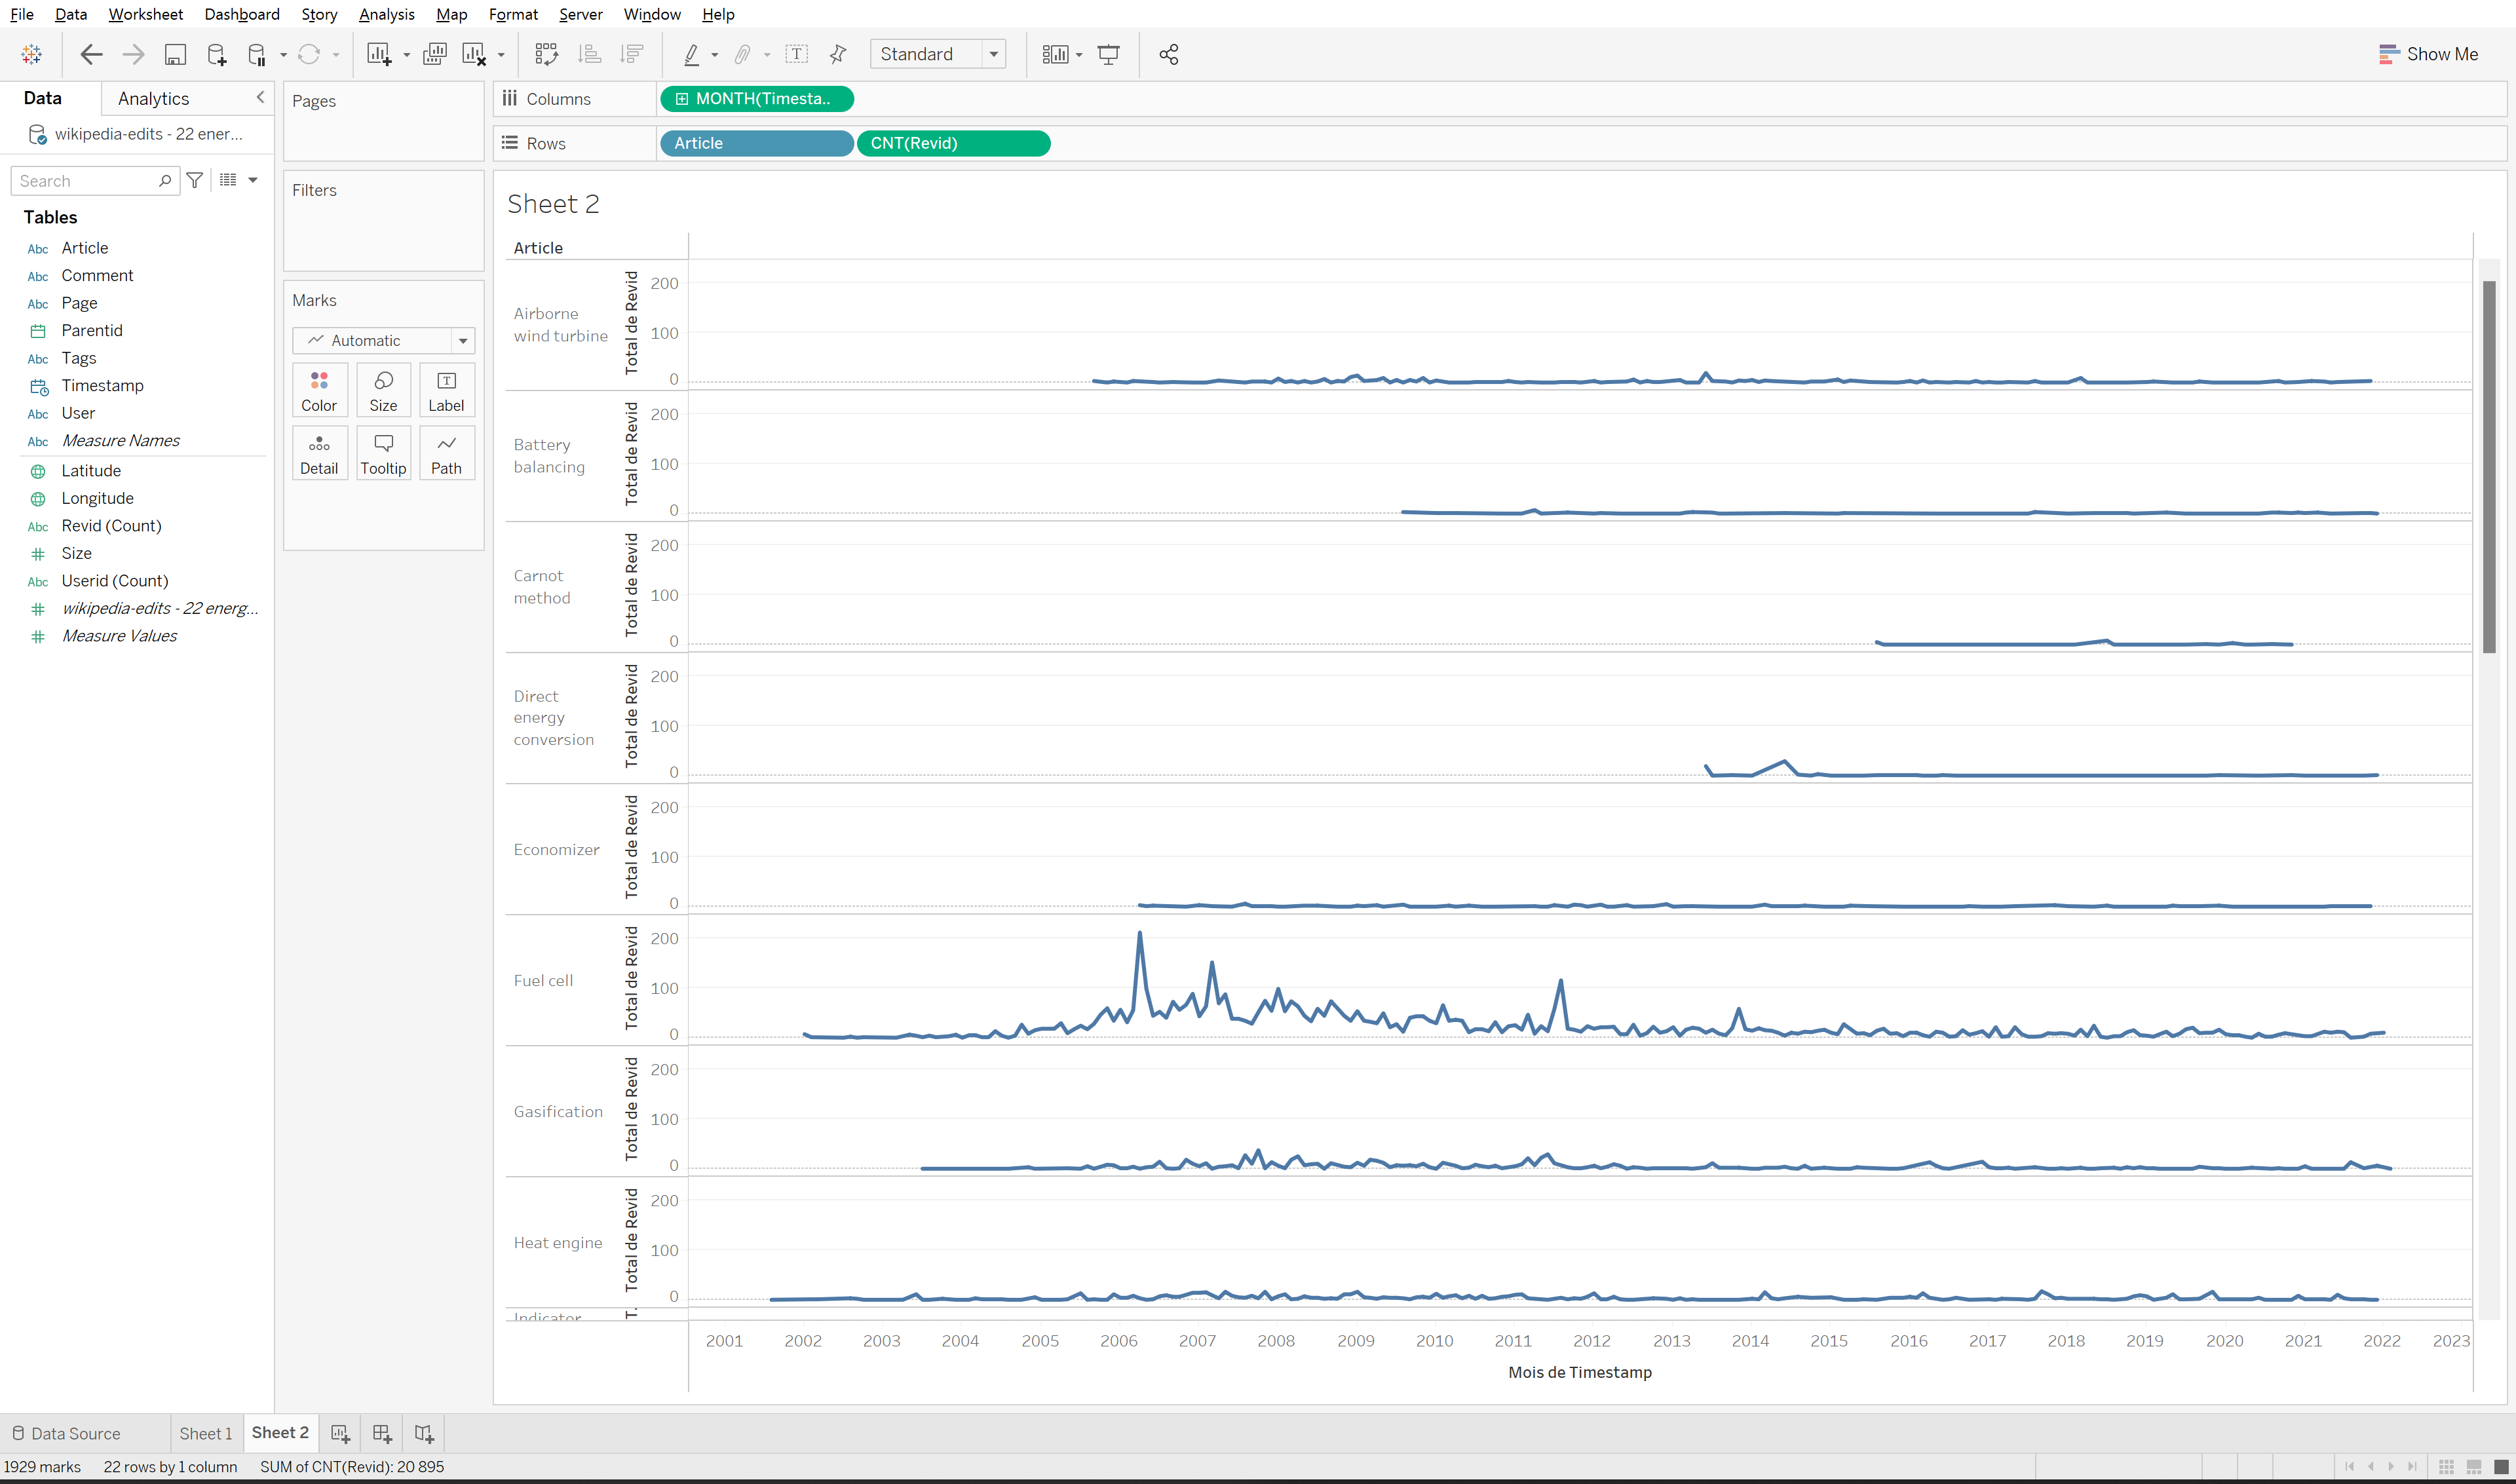
…or maybe like that…
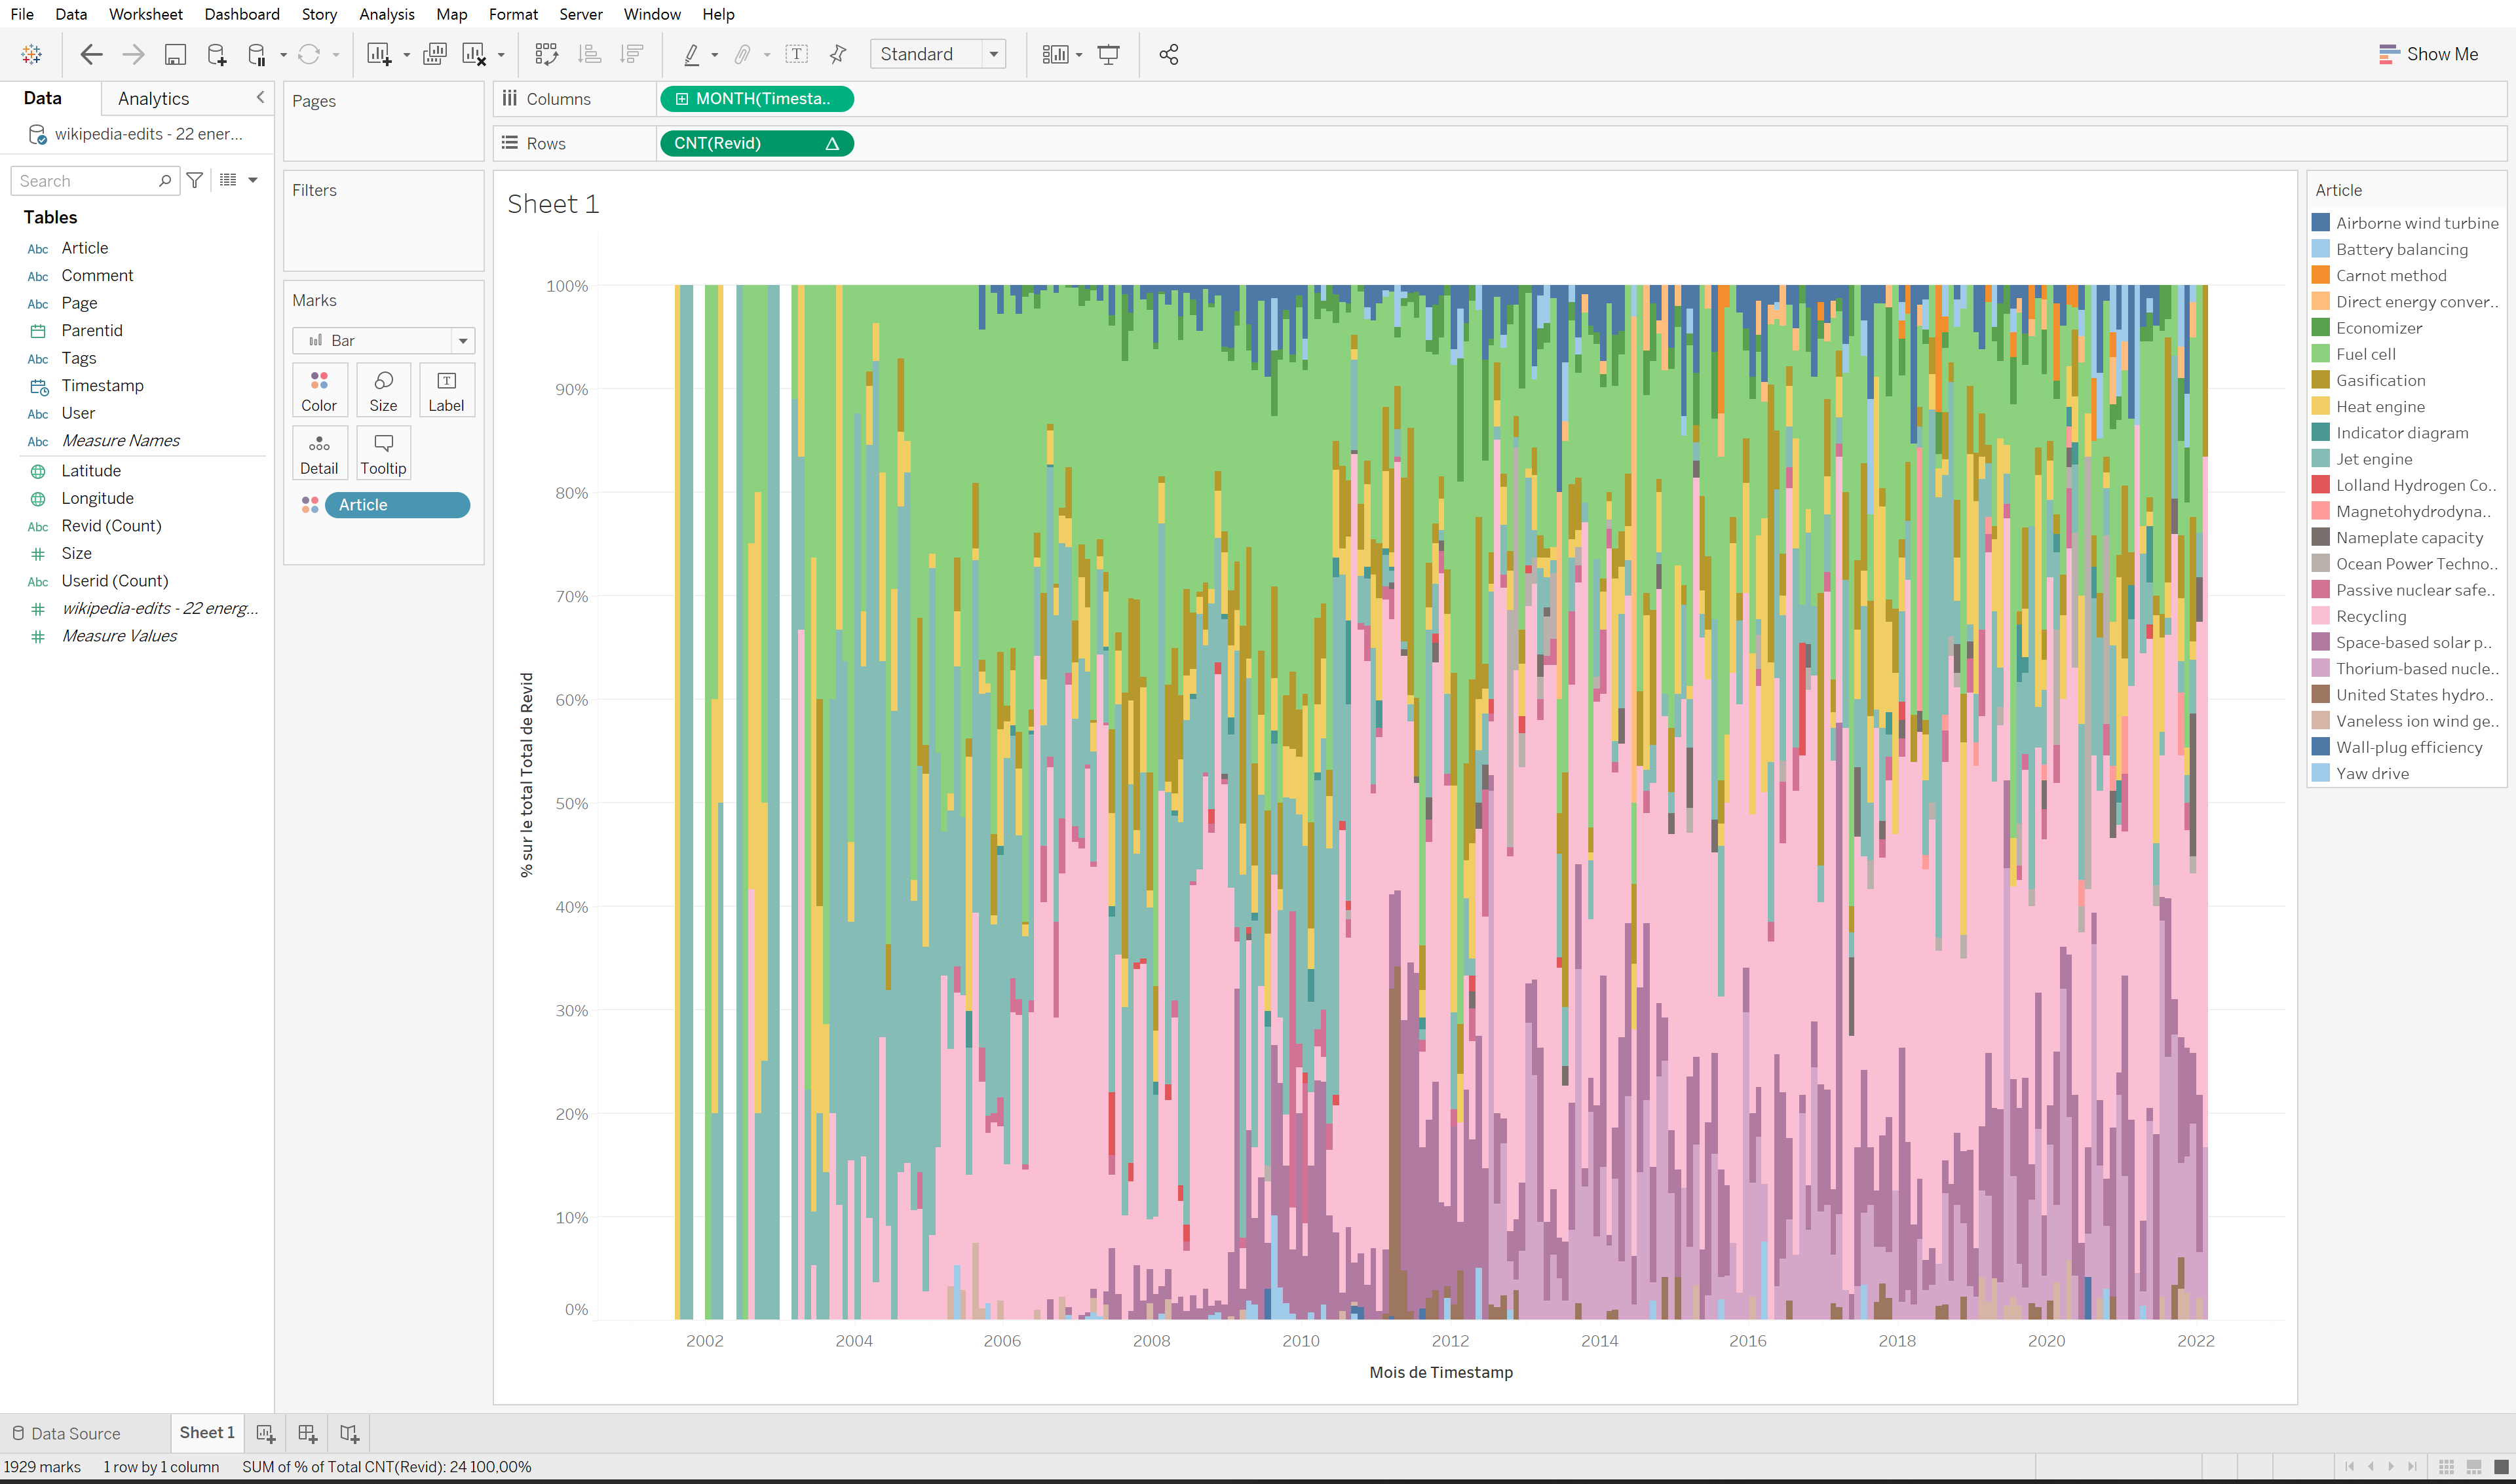
…and there are many other possibilities.
The notebook allows dealing with bigger data, which unlocks new research questions. You may pick one of those for your annotations:
- Are the articles synchronized or not? Are they edited at the same time?
- Are some articles older, more recent? Note: would you look at the date of first edit, or something else?
- Are there different moments where different articles get the most revisions?
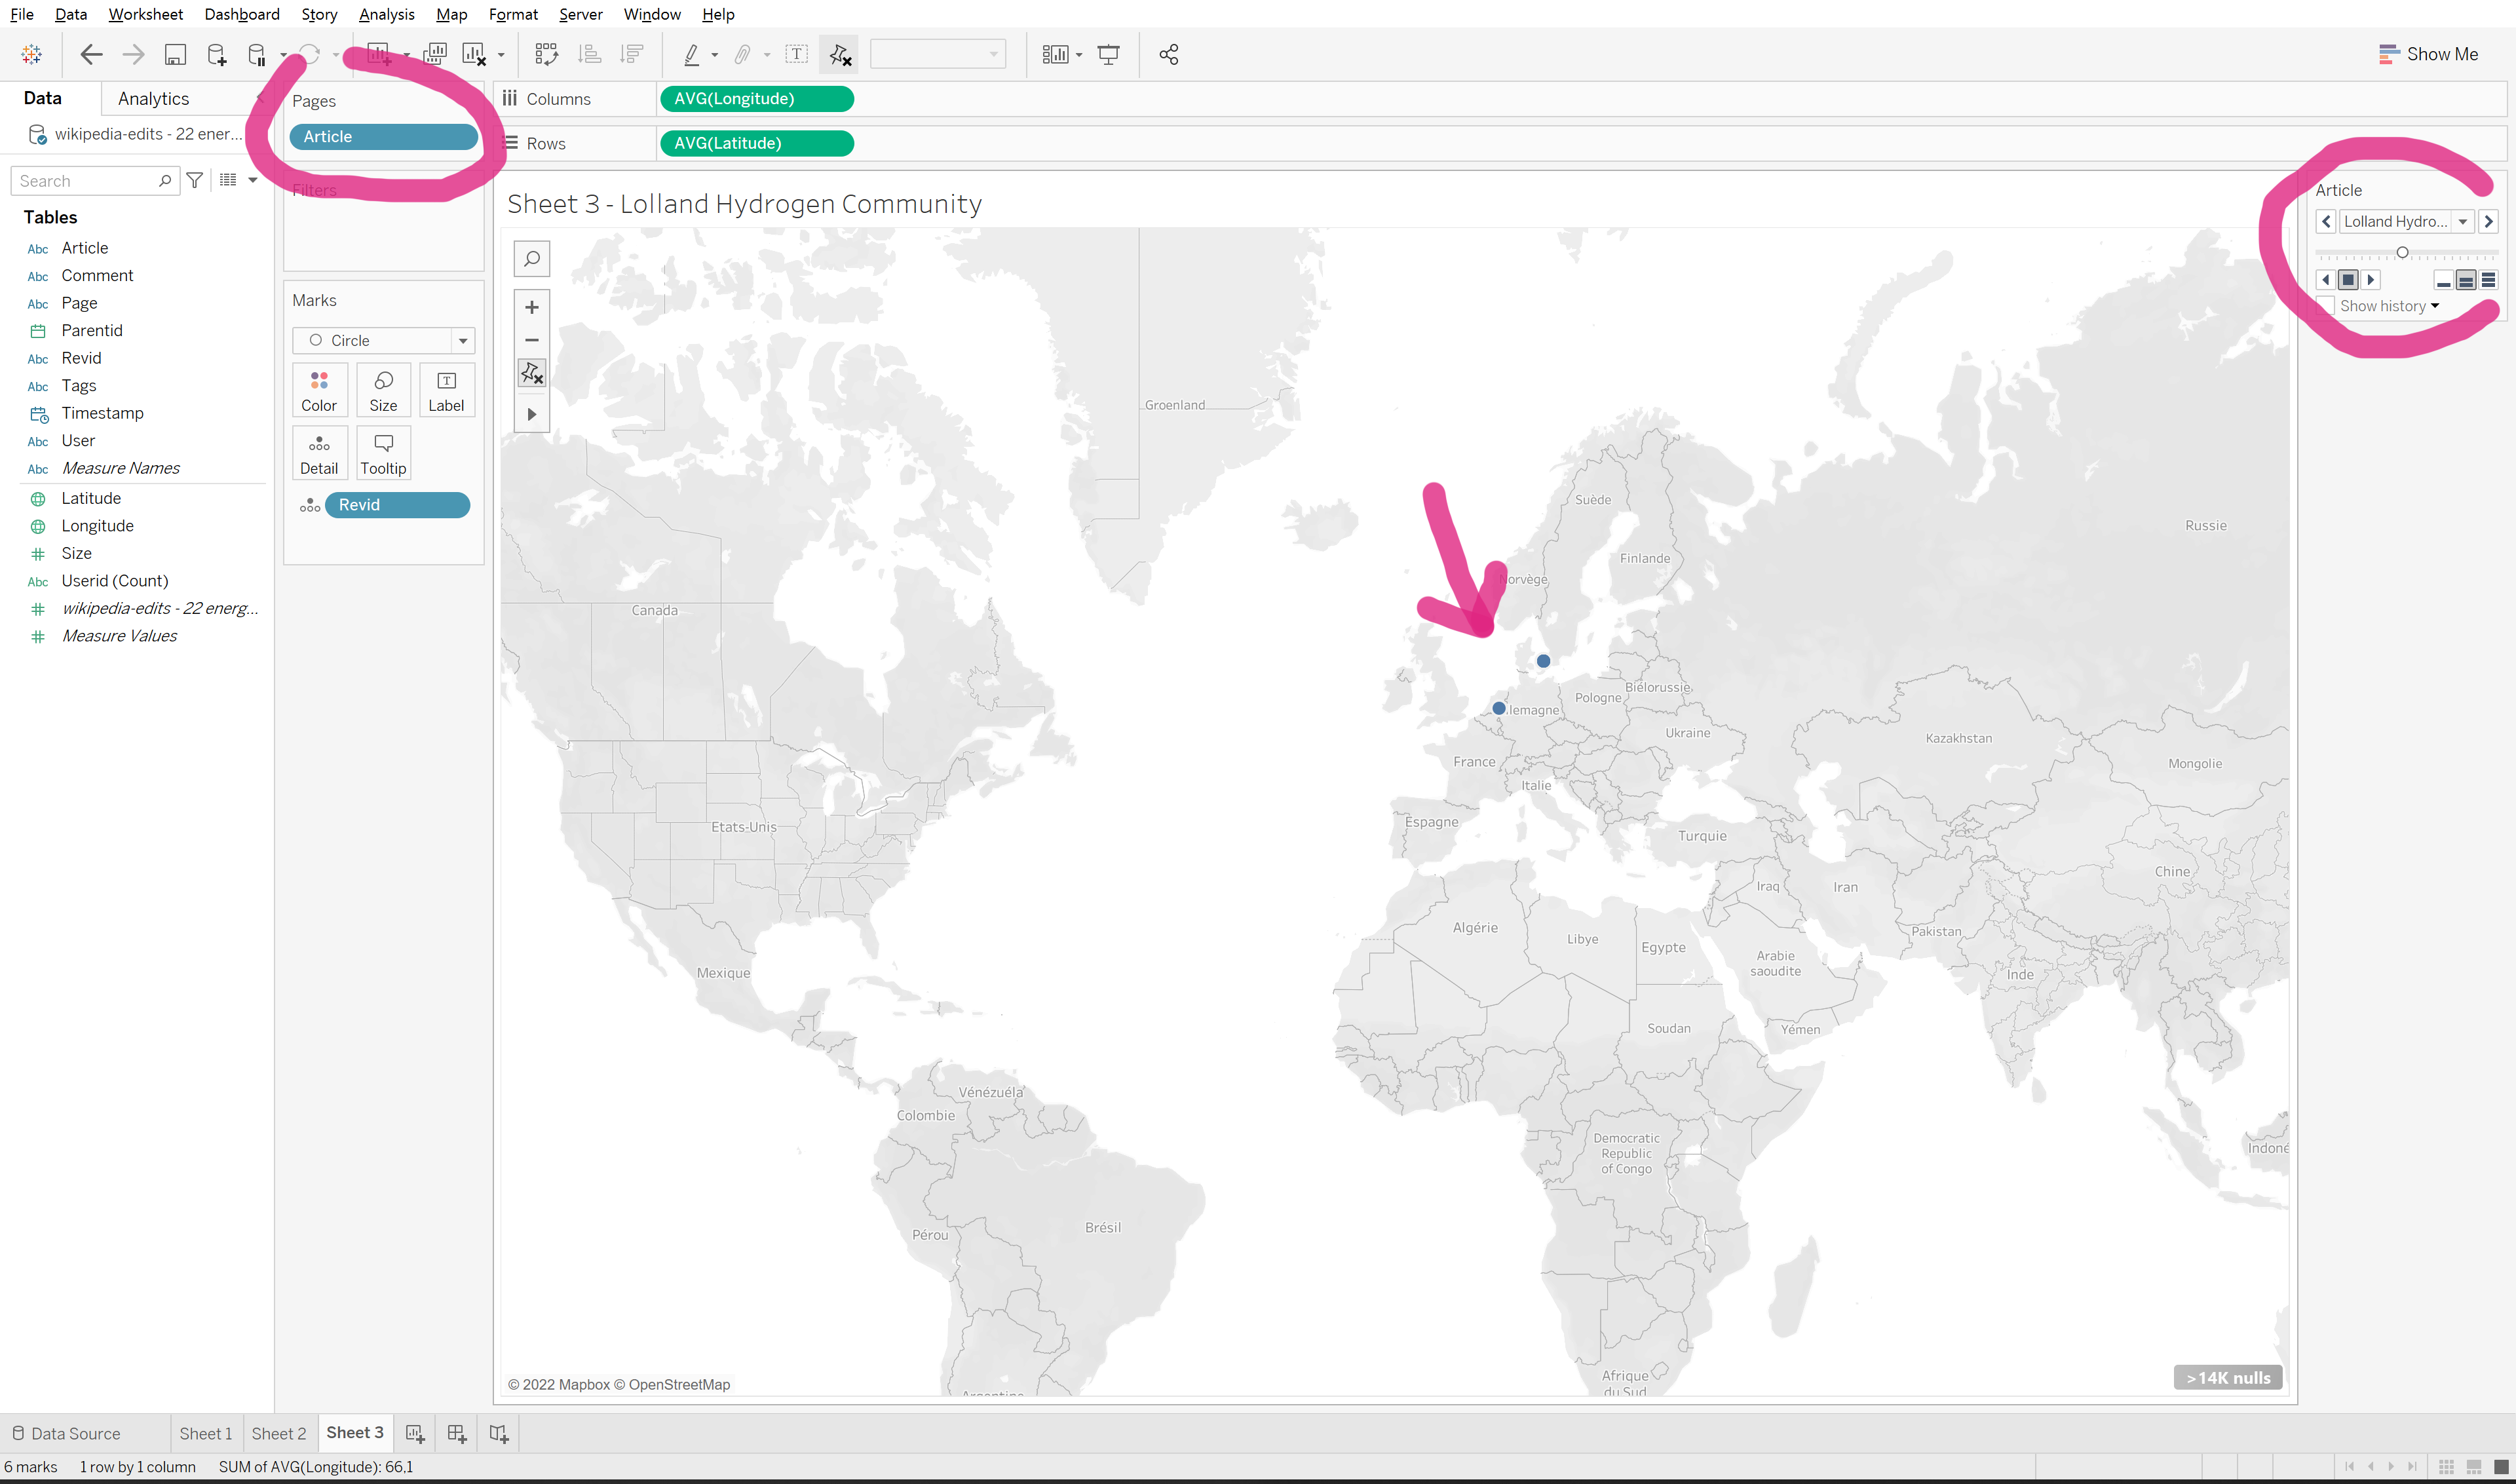
- Are certain articles only edited in certain parts of the world?
Tip: you can use the Article dimension in Tableau’s Pages shelf (see help) to quickly compare across Articles.
Documents produced
Keep somewhere, for sharing, the following document:
- The annotated visualization (JPEG or PNG)
Next tutorial
Last break before lunch! Then head for the last activity of the morning:
1.7. Activate your knowledge about Tableau (30 min)
Additional resources
- Intro to Google Colab in 3 minutes.
- A list of other endpoints you could call with a script to get data from the Wikipedia API.
Relation to the course readings
- The process of getting data through APIs is covered in Chapter 6: Collecting and curating digital records of Venturini, T. & Munk, A.K. (2021). Controversy Mapping: A Field Guide.
- The intricacies of Wikipedia and the different ways in which the platform may be reappropriated for controversy analysis are covered in Weltevrede, E., & Borra, E. (2016). Platform affordances and data practices: The value of dispute on Wikipedia Big Data & Society, 3(1).
Tools for getting similar data (CSV format with timestamps) from other sources:
- Search interest over time with Google Trends. Note that this can be filtered to geographical regions or other Google platforms such as YouTube, News or Shopping.
- Publication activity around a topic over time in scientific journals with Scopus. Note that you will need to use your university login.
- Activity on public Facebook pages over time with FacePager. Note that you will need to install the software.